
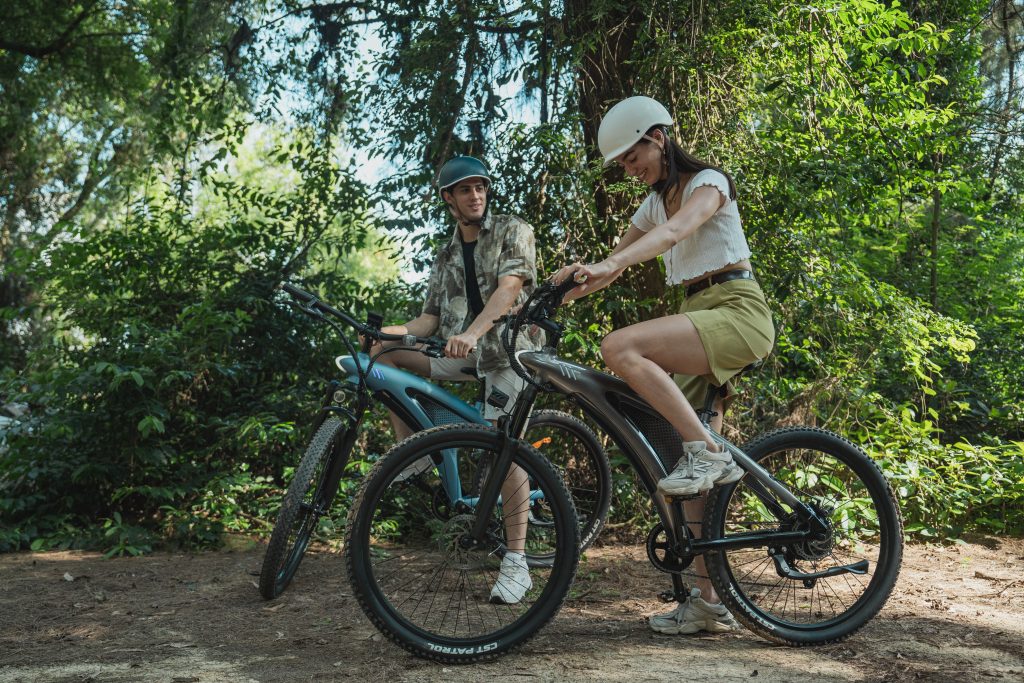
Which is the best electric mountain bike for adults? Top Picks for 2026
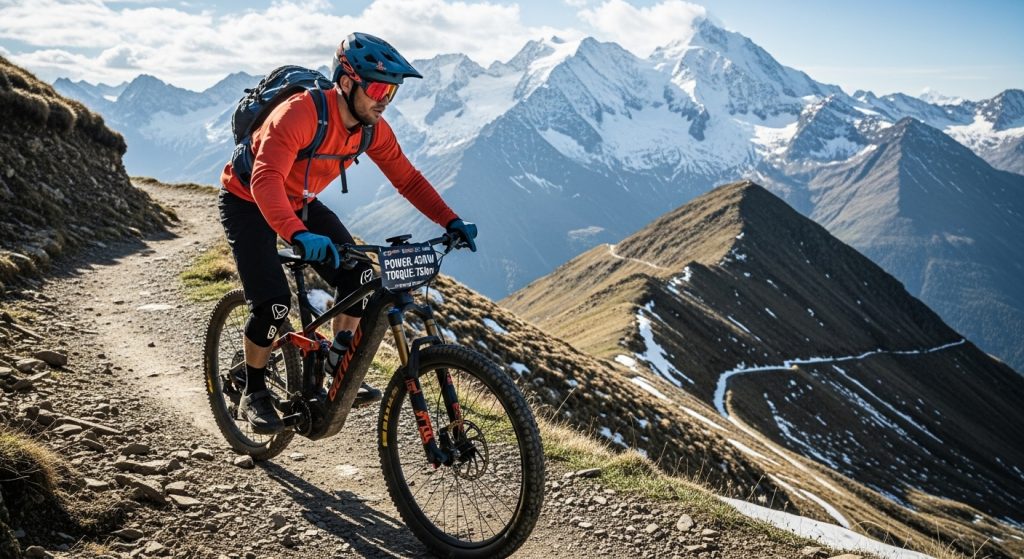
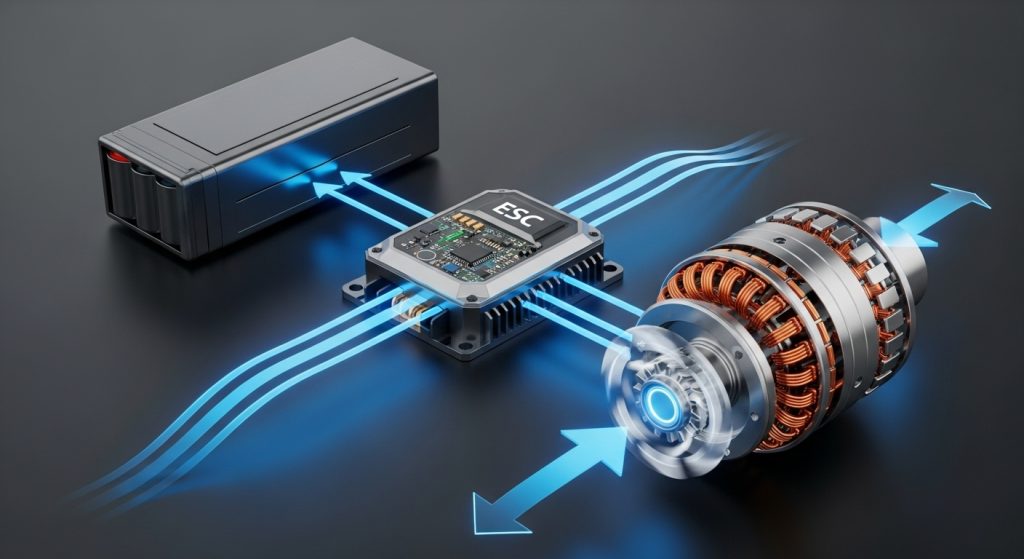
Choosing the right electric bike can feel overwhelming. With so many types, features, and price points, it is hard to know where to start. You want a bike that fits your lifestyle, whether you are commuting to work, exploring trails, or just enjoying a leisurely ride. The fear of making the wrong choice can be paralyzing, leaving you stuck with a bike that does not meet your needs or, worse, one that gathers dust in the garage. The best electric bike for adults is one that aligns with your primary use, offers the right balance of motor power and battery range, and provides a comfortable and safe riding experience. For many, a versatile and powerful model like the Dynamic Scooter Q5, which blends the capabilities of a mountain bike with the comfort of a commuter, is the ideal solution. This guide will break down the key factors to consider, helping you understand the options and find the perfect electric bike to fit your life. Let’s find your ride. 1. What Are the Different Types of Electric Bikes? Not all electric bikes are created equal. The first step in choosing the right one is to understand the different types available. Each is designed for a specific purpose, so matching the bike to your intended use is key. Electric mountain bikes (e-MTBs) are built for off-road adventures. Here’s the deal… they feature durable frames, powerful motors, and suspension to handle rough terrain. They are perfect for anyone who wants to ride trails and tackle steep climbs. A great example is the Dynamic Scooter Q5, which is designed to handle both trails and city streets. Electric commuter or hybrid bikes are designed for city riding. They offer a comfortable, upright riding position and often come with practical features like fenders and racks. They are a fantastic option for getting to work or running errands. Electric cruiser bikes are all about comfort. They have wide, swept-back handlebars, comfortable saddles, and a relaxed riding position. They are ideal for leisurely rides. Electric fat tire bikes have oversized tires that provide excellent stability and traction on a variety of surfaces, including sand, snow, and mud. They are a great choice for riders who want to go anywhere. E-Bike Type Primary Use Key Features Electric Mountain Bike Off-road trails, climbing Durable frame, suspension, powerful motor Electric Commuter/Hybrid City riding, errands Upright position, fenders, racks Electric Cruiser Leisurely rides, comfort Relaxed position, wide handlebars Electric Fat Tire All-terrain, sand, snow Oversized tires for stability Understanding these categories will help you narrow down your choices and focus on the type of bike that best fits your needs. 2. What Key Factors Should Adults Consider? Once you have an idea of the type of e-bike you want, it is time to dig into the details. There are a few key factors that every adult should consider to ensure they are getting a bike that is a perfect fit. Your intended use is the most important factor. Now, you might be wondering… why is this so crucial? Because a bike designed for commuting will not be the best choice for hitting the trails, and vice versa. Be honest about how you plan to use your bike most of the time. Next, consider the motor type. The two main options are mid-drive motors and hub motors. Mid-drive motors are located in the center of the bike and provide a more natural, balanced feel. Hub motors are located in the wheel hub and are often more affordable. For hilly terrain, a mid-drive motor is usually better. Battery range is another critical consideration. Think about how far you typically ride. You want a battery that can comfortably handle your longest rides without causing “range anxiety.” Look at the battery’s capacity, measured in Watt-hours (Wh). Finally, do not overlook comfort and fit. An uncomfortable bike will not get ridden. Make sure the frame size is right for your height. Look for a bike with an adjustable saddle and handlebars. Factor Why It Matters What to Look For Intended Use Determines the right type of bike Commuting, fitness, trails, leisure Motor Type Affects performance and feel Mid-drive for hills, hub for value Battery Range Ensures you can complete your rides Sufficient Watt-hours (Wh) for your needs Comfort and Fit A comfortable bike gets ridden more Correct frame size, adjustable components By carefully considering these factors, you can make a much more informed decision and choose an e-bike that you will love to ride for years to come. 3. How Do You Choose the Right Motor Power? Motor power is one of the most talked-about features of an electric bike, but it can also be one of the most confusing. Understanding what the numbers mean will help you choose a bike with the right amount of power. Motor power is typically measured in Watts (W). You will see numbers like 250W, 500W, and 650W. But here’s the thing… higher wattage generally means more power and faster acceleration. For flat terrain and lighter riders, a 250W motor might be sufficient. For heavier riders or those who plan to tackle hills, a 500W or 650W motor is better. Torque, measured in Newton-meters (Nm), is another important number. Torque is the rotational force that gets you moving from a stop and helps you power up hills. A motor with higher torque will feel more powerful, especially on climbs. Look for a motor with at least 50Nm of torque. It is important to match the motor power to your weight and the type of terrain you will be riding on. A heavier rider will need more power to get up a hill. If you live in a hilly area, you will appreciate a more powerful motor. The Dynamic Scooter Q5, with its 650W motor (peaking at 1000W) and high torque, is a great example of a bike that can handle a wide range of riders and terrains. Motor Spec What It Means What to Look For Wattage (W) Overall power […]
Which is the best electric mountain bike for adults? Top Picks for 2026 Read More »